| Listing 1 - 6 of 6 |
Sort by
|

ISBN: 1280727098 9786610727094 3540495460 3540255230 Year: 2007 Publisher: Berlin, Heidelberg : Springer Berlin Heidelberg : Imprint: Springer,
Abstract | Keywords | Export | Availability | Bookmark
 Loading...
Choose an application
- Reference Manager
- EndNote
- RefWorks (Direct export to RefWorks)
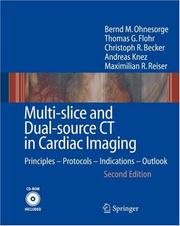
Preface to the Second Edition Despite worldwide efforts to assess and control cardiovascular risk factors, cardiac diseases and in particular coronary artery disease (CAD) are still the foremost causes of death in the developed countries of Western Europe, North America and Asia and are becoming increasingly common in Eastern Europe and the developing world (Deanfield 2001). Approximately one in five deaths is currently related to cardiac disease in Europe and the US. Nearly 500,000 deaths caused by CAD are reported every year in the US, over 600,000 in Europe, 170,000 of these in Germany alone. Over 12 million US citizens have a history of CAD, while every year 1. 1 million US and 300,000 German citizens suffer a coronary attack and more than 40% will die as a result of these attacks. Every second patient dies without prior symptoms and, in most cases, myocardial infarction occurs without warning. Once a blockage of the coronary arteries has occurred, death may ensue within a few minutes, even before hospitalization is possible. These alarming statistics highlight an acute need for tools to diagnose cardiac and coronary artery disease. Presently, the gold-standard mod- ity for diagnosis of CAD is invasive selective coronary angiography. More than 2.
Heart --- Imaging. --- Diseases --- Diagnosis. --- Cardiac diagnostic imaging --- Cardiac imaging --- Diagnostic cardiac imaging --- Imaging of the heart --- Imaging --- WG 141.5 Cardiovascular Diseases, Diagnosis and Therapeutics -- Specific diagnostic methods --- Diagnosis --- Heart Diseases --- Tomography, X-Ray Computed --- Radiology, Medical. --- Cardiology. --- Imaging / Radiology. --- Internal medicine --- Clinical radiology --- Radiology, Medical --- Radiology (Medicine) --- Medical physics --- Radiology. --- Radiological physics --- Physics --- Radiation
Book
Abstract | Keywords | Export | Availability | Bookmark
 Loading...
Choose an application
- Reference Manager
- EndNote
- RefWorks (Direct export to RefWorks)
WA 900 Public health statistics (including narrative reports on health conditions and health surveys) --- WA 900 Public health statistics (including narrative reports on health conditions and health surveys) --- WA 900 Public health statistics (including narrative reports on health conditions and health surveys) --- Data Collection --- Data Collection --- Data Collection --- Diagnostic Imaging --- Diagnostic Imaging --- Diagnostic Imaging --- Diagnostic Tests Routine --- Diagnostic Tests Routine --- Diagnostic Tests Routine --- France --- France --- France
Book
ISBN: 9783319242750 Year: 2016 Publisher: Switzerland : Springer,
Abstract | Keywords | Export | Availability | Bookmark
 Loading...
Choose an application
- Reference Manager
- EndNote
- RefWorks (Direct export to RefWorks)
This new edition to the classic book by ggplot2 creator Hadley Wickham highlights compatibility with knitr and RStudio. ggplot2 is a data visualization package for R that helps users create data graphics, including those that are multi-layered, with ease. With ggplot2, it's easy to : (-) produce handsome, publication-quality plots with automatic legends created from the plot specification ; (-) superimpose multiple layers (points, lines, maps, tiles, box plots) from different data sources with automatically adjusted common scales ; (-) add customizable smoothers that use powerful modeling capabilities of R, such as loess, linear models, generalized additive models, and robust regression ; (-) save any ggplot2 plot (or part thereof) for later modification or reuse ; (-) create custom themes that capture in-house or journal style requirements and that can easily be applied to multiple plots ; (-) approach a graph from a visual perspective, thinking about how each component of the data is represented on the final plot. This book will be useful to everyone who has struggled with displaying data in an informative and attractive way. Some basic knowledge of R is necessary (e.g., importing data into R). ggplot2 is a mini-language specifically tailored for producing graphics, and you'll learn everything you need in the book. After reading this book you'll be able to produce graphics customized precisely for your problems, and you'll find it easy to get graphics out of your head and on to the screen or page.
Graphic methods. --- R (Computer program language) --- GNU-S (Computer program language) --- Domain-specific programming languages --- Graphics --- Graphs --- Geometrical drawing --- Least squares --- Mathematics --- Mechanical drawing --- Data Interpretation, Statistical --- Systems Analysis --- Software --- Computer Imaging, Graphics & Vision --- QA 76.755 - Computer Software. Handbook --- Graphic methods --- Statistics --- Computer graphics --- Visualization --- Mathematical statistics --- Statistiques. --- Statistique mathématique. --- Infographie --- Data visualisation. --- Logiciels. --- Statistiques

ISBN: 0387403604 9786610189199 1280189193 0387217029 9780387403601 Year: 2002 Publisher: New York, NY : Springer,
Abstract | Keywords | Export | Availability | Bookmark
 Loading...
Choose an application
- Reference Manager
- EndNote
- RefWorks (Direct export to RefWorks)
Upon publication of the First Edition, Fundamentals of Nuclear Pharmacy has emerged as the standard text reference in nuclear medicine. Generously supplemented with charts, tables, and more than 100 illustrations, the new Fifth Edition of this classic text has been thoroughly updated by judiciously replacing obsolete sections with new, cutting-edge material. Each chapter provides the reader with well-delineated descriptions of the subject matter, from the basic atomic structure to the clinical uses of radiopharmaceuticals. Previous editions were highly acclaimed for their clarity and accuracy; Dr. Saha set new standards for making complex theoretical concepts readily understandable for students and practitioners in nuclear pharmacy and nuclear medicine.
Radiopharmaceuticals. --- Nuclear medicine. --- WN 440 Nuclear medicine --- Radiopharmaceuticals --- Nuclear Medicine --- Produits radiopharmaceutiques --- Nuclear medicine --- Radiopharmaceutiques --- Médecine nucléaire --- Pharmacy. --- Medicine. --- Radiology. --- Radiotherapy. --- Medicine & Public Health. --- Nuclear Medicine. --- Imaging / Radiology. --- Médecine nucléaire --- Pharmacy --- EPUB-LIV-FT SPRINGER-B --- Radiology, Medical. --- Médecine nucléaire. --- Produits radiopharmaceutiques. --- Radiation therapy --- Electrotherapeutics --- Hospitals --- Medical electronics --- Medical radiology --- Therapeutics, Physiological --- Phototherapy --- Radiological physics --- Physics --- Radiation --- Chemistry --- Medicine --- Drugs --- Materia medica --- Pharmacology --- Atomic medicine --- Radioisotopes in medicine --- Radioactive tracers --- Radioactivity --- Radiological services --- Physiological effect --- Analysis.

ISBN: 0963488406 9780963488404 Year: 1993 Publisher: Murray Hill AT and T Bell laboratories
Abstract | Keywords | Export | Availability | Bookmark
 Loading...
Choose an application
- Reference Manager
- EndNote
- RefWorks (Direct export to RefWorks)
Visualization methods. A strategy for data analysis that stresses the use of visualization to thoroughly study the structure of data and to check the validity of mathematical and statistical models fitted to data. Prerequisites: Basic statistics and least-squares fitting.
Mathematical statistics --- Statistique mathématique --- Graphic methods --- Méthodes graphiques --- 519.25 --- AA / International- internationaal --- 302 --- 001.4224 --- -Mathematical statistics --- -Mathematics --- Statistical inference --- Statistics, Mathematical --- Statistics --- Probabilities --- Sampling (Statistics) --- Statistical data handling --- Opmaak en presentatie van statistische reeksen en tabellen. Grafieken. --- Statistical methods --- -Statistical data handling --- 519.25 Statistical data handling --- -519.25 Statistical data handling --- Mathematics --- Statistique mathématique --- Méthodes graphiques --- Opmaak en presentatie van statistische reeksen en tabellen. Grafieken --- Mathematical statistics - Graphic methods --- QA 276.3 Graphic methods --- Methods --- Computer Imaging, Graphics & Vision

ISBN: 0387329064 9780387329062 9786610938421 1280938420 0387379770 Year: 2006 Publisher: New York, NY : Springer New York : Imprint: Springer,
Abstract | Keywords | Export | Availability | Bookmark
 Loading...
Choose an application
- Reference Manager
- EndNote
- RefWorks (Direct export to RefWorks)
Graphics are great for exploring data, but how can they be used for looking at the large datasets that are commonplace to-day? This book shows how to look at ways of visualizing large datasets, whether large in numbers of cases or large in numbers of variables or large in both. Data visualization is useful for data cleaning, exploring data, identifying trends and clusters, spotting local patterns, evaluating modeling output, and presenting results. It is essential for exploratory data analysis and data mining. Data analysts, statisticians, computer scientists-indeed anyone who has to explore a large dataset of their own-should benefit from reading this book. New approaches to graphics are needed to visualize the information in large datasets and most of the innovations described in this book are developments of standard graphics. There are considerable advantages in extending displays which are well-known and well-tried, both in understanding how best to make use of them in your work and in presenting results to others. It should also make the book readily accessible for readers who already have a little experience of drawing statistical graphics. All ideas are illustrated with displays from analyses of real datasets and the authors emphasize the importance of interpreting displays effectively. Graphics should be drawn to convey information and the book includes many insightful examples. Antony Unwin holds the Chair of Computer Oriented Statistics and Data Analysis at the University of Augsburg. He has been involved in developing visualization software for twenty years. Martin Theus is a Senior Researcher at the University of Augsburg, has worked in industry and research in both Germany and the USA, and is the author of the visualization software Mondrian. Heike Hofmann is Assistant Professor of Statistics at Iowa State University. She wrote the software MANET and has also cooperated in the development of the GGobi software.
Artificial intelligence. Robotics. Simulation. Graphics --- Information systems --- QA 276.3 Graphic methods --- Computational Science & Engineering --- Computational Statistics --- Computer Imaging, Graphics & Vision --- Computer Science --- Statistics --- Computer graphics. --- Statistique --- Infographie --- Graphic methods. --- Méthodes graphiques --- Computer graphics --- Graphic methods --- Statistics -- Graphic methods. --- Mathematics --- Physical Sciences & Mathematics --- Mathematical Statistics --- Méthodes graphiques --- EPUB-LIV-FT LIVSTATI SPRINGER-B --- Automatic drafting --- Graphic data processing --- Graphics, Computer --- Diagrams, Statistical --- Statistical diagrams --- Mathematics. --- Operations research. --- Decision making. --- Data mining. --- Visualization. --- Computer software. --- Statistics. --- Mathematical Software. --- Statistical Theory and Methods. --- Data Mining and Knowledge Discovery. --- Operation Research/Decision Theory. --- Computer Graphics. --- Computer art --- Graphic arts --- Electronic data processing --- Engineering graphics --- Image processing --- Statistical analysis --- Statistical data --- Statistical methods --- Statistical science --- Econometrics --- Software, Computer --- Computer systems --- Visualisation --- Imagery (Psychology) --- Imagination --- Visual perception --- Algorithmic knowledge discovery --- Factual data analysis --- KDD (Information retrieval) --- Knowledge discovery in data --- Knowledge discovery in databases --- Mining, Data --- Database searching --- Deciding --- Decision (Psychology) --- Decision analysis --- Decision processes --- Making decisions --- Management --- Management decisions --- Choice (Psychology) --- Problem solving --- Operational analysis --- Operational research --- Industrial engineering --- Management science --- Research --- System theory --- Math --- Science --- Digital techniques --- Decision making --- Curve fitting --- Mathematical statistics. --- Operations Research/Decision Theory. --- Statistical inference --- Statistics, Mathematical --- Probabilities --- Sampling (Statistics) --- Statistics . --- Statistics - Graphic methods
| Listing 1 - 6 of 6 |
Sort by
|

 Search
 Feedback
 About
About Help
Help News
News